
In June 2025, Gartner dropped a number that should have rattled everyone building AI agents: more than 40% of agentic AI projects will be canceled by the end of 2027. Not because the models got worse. Because the projects couldn't show their value.
Dig into the why and the pattern repeats. One widely-cited figure puts it bluntly — 42% of AI projects show zero ROI because of measurement failures. The agent might be doing real work. Nobody can prove it.
That's the gap AI agent analytics closes. It's the difference between "the bot seems to be working" and "the bot resolved 68% of tickets end-to-end last month at $0.74 each, up from 51% in March." One of those sentences keeps a project funded. The other gets it canceled.
I've spent a lot of time inside agent dashboards — the good ones and the ones that show you a vanity number and call it a day. This guide is the version I wish I'd had when I started: what AI agent analytics actually means, which metrics matter (and which ones lie to you), the tools worth wiring up, and how to turn all of it into an agent that gets better instead of just older.
If you're still fuzzy on what an agent even is versus a plain chatbot, start with what AI agents actually are and how they differ from chatbots, then come back. Everything below assumes your agent can plan, call tools, and act in a loop — not just answer one question and stop.
What AI agent analytics actually means
AI agent analytics is the practice of capturing, measuring, and interpreting everything your agent does in production so you can judge whether it's working and make it work better. It spans three things: what the agent did (traces and logs), how well it did it (quality and outcome metrics), and what it cost and earned (tokens, dollars, and business impact).
That sounds obvious. It isn't, because agents broke most of the analytics habits we brought over from the software and chatbot eras.
A traditional app is deterministic. Same input, same output. You track uptime, errors, latency, and you're basically covered. An agent is probabilistic and autonomous — it decides which tools to call, how to phrase things, when to give up. The same question can take three different paths on three different days.
So agent analytics has to answer questions traditional monitoring never asked. Did the agent choose the right tool? Did it hallucinate a policy that doesn't exist? Did it loop forever and burn $4 in tokens on a question worth two cents? Did the customer actually get helped, or just get a confident-sounding non-answer?
Think of it as three overlapping disciplines:
- Observability — the raw instrumentation: traces, spans, logs of every model call, tool invocation, and decision.
- Evaluation — scoring the quality of those outputs, automatically and at scale, against things like accuracy, faithfulness, and tone.
- Business analytics — rolling all of it up into the numbers a stakeholder cares about: resolution rate, cost per task, ROI, CSAT.
Most teams nail one of these and ignore the other two. The ones whose projects survive do all three.
Why your old metrics are quietly lying to you
Before we get to the metrics that work, it's worth naming the ones that don't — because they're the ones most dashboards still lead with.
Response time. This was a meaningful service metric when a human had to read, think, and type. An agent that answers in 1.8 seconds makes "average first response time" a vanity stat. Fast and wrong is worse than slow and right.
Deflection rate. The metric that defined the chatbot era. It counts how many conversations never reached a human — but a conversation can avoid a human because it was resolved or because the customer gave up in frustration. Deflection can't tell those apart. As one framework I read put it, deflection "tells you nothing about whether customers actually got help."
Raw volume. "We handled 40,000 conversations this month" feels like progress. It's not a quality signal. A misconfigured agent can handle 40,000 conversations badly and propagate the same error across every one of them simultaneously — a failure mode that simply didn't exist when humans handled tickets one at a time.
This is the core insight from nearly every 2026 measurement framework I came across, including Microsoft's agent performance work: no single metric can tell you whether an AI agent truly works. Speed, accuracy, reasoning quality, and customer experience trade off against each other. Optimize one in isolation and you quietly wreck another.
The fix isn't a better single number. It's a balanced scorecard.
The metrics that actually matter
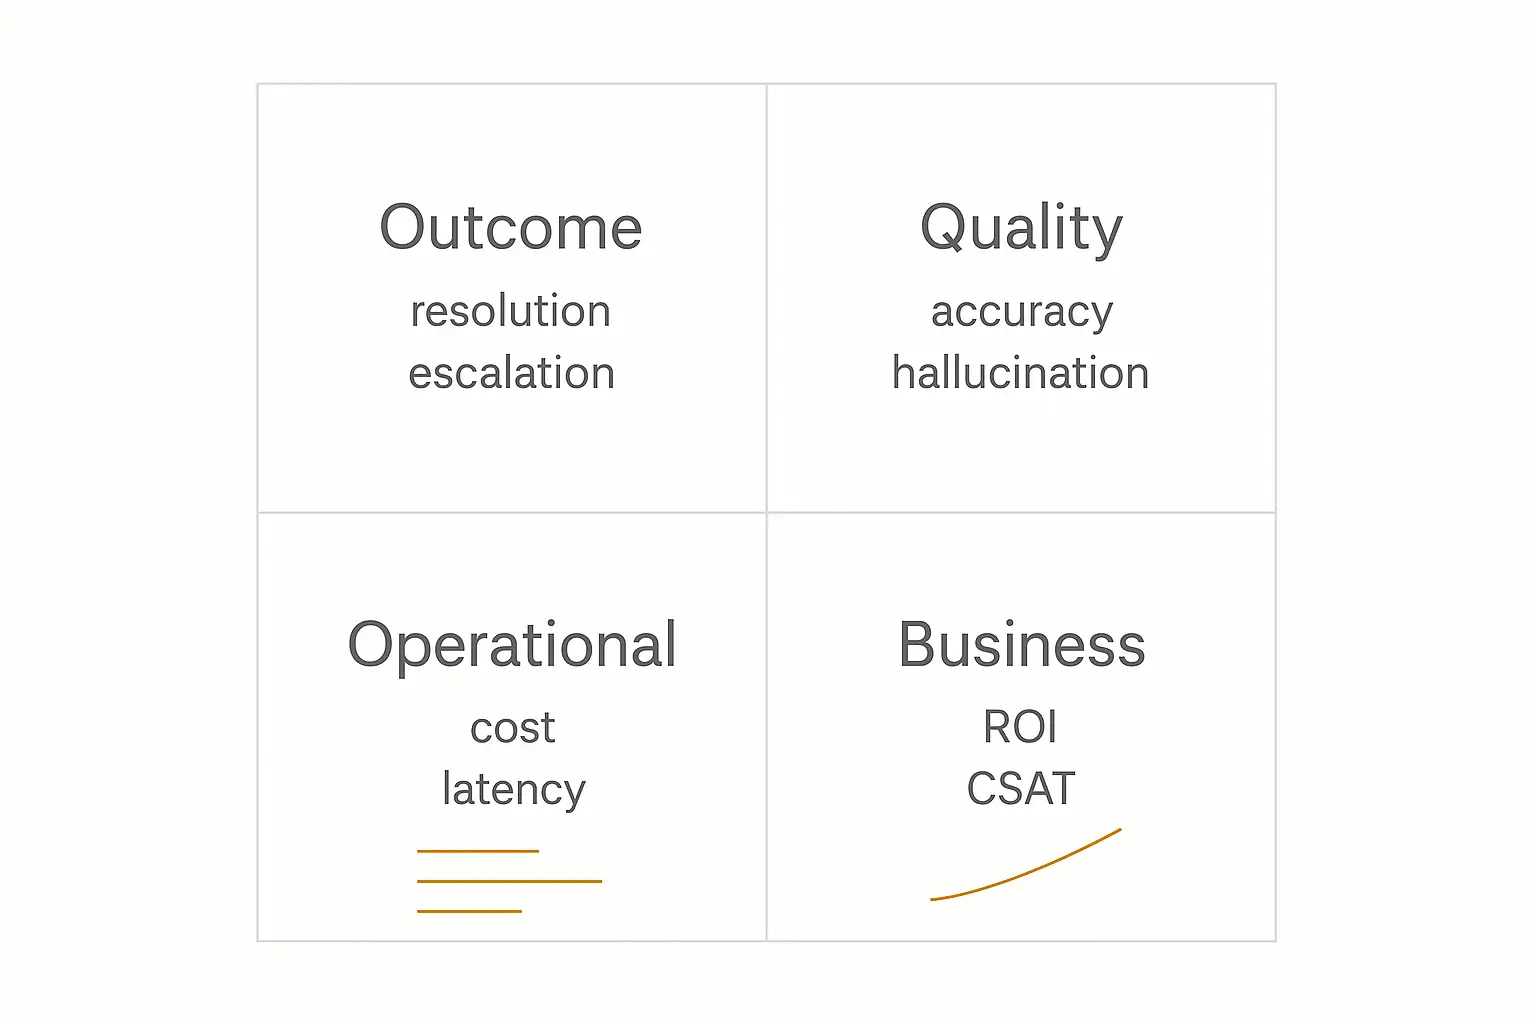
Here's the scorecard I'd build for almost any production agent, grouped into four tiers. You won't track all of these from day one — but you should know which tier each number lives in, because mixing them up is how teams fool themselves.
| Tier | Metric | What it measures | Healthy benchmark |
|---|---|---|---|
| 1. Outcome | Resolution rate | % of requests fully handled end-to-end, no human | 55–70% typical; 80%+ elite |
| Reopen rate | "Resolved" cases the user comes back about within 24–48h | Below 10% | |
| Escalation rate | Handoffs to a human | Should decline over time | |
| 2. Quality | Hallucination rate | % of responses with fabricated or wrong info | Below 1%; leaders ~0.01% |
| Task accuracy | Did the agent do the thing correctly? | Task-dependent; trend up | |
| Tool-call success | % of tool/action calls that succeed | 95%+ | |
| 3. Operational | Cost per resolution | Dollar cost of each resolved task | Trend down as you optimize |
| Tokens per task | Compute consumed per interaction | Flat or falling at scale | |
| Latency (p95) | Time to complete, 95th percentile | Use case-dependent | |
| 4. Business | ROI | Return per dollar invested | ~$3.50 avg; 8x for top performers |
| CSAT delta | Satisfaction change after deploying the agent | Stable or improving | |
| Containment | Share of workload safely handled without humans | 60%+ at maturity |
A few of these deserve a closer look, because they're the ones people get wrong.
Resolution rate, not deflection
Resolution rate is deflection's grown-up sibling. It only counts a conversation as a win if the user's request was actually completed — not just kept away from a human. Benchmarks I found cluster around 55–70% for a healthy agent, with top performers crossing 80%. Intercom's Fin, for example, reports averaging around 76%.
Pair it with reopen rate. A high resolution rate with a high reopen rate means your agent is great at declaring victory and bad at achieving it. Below 10% reopens is the bar.
Hallucination rate is now a first-class metric
This is the one that didn't exist five years ago and now sits near the top of every serious framework. A fabricated refund policy or an invented API parameter isn't a rounding error — it's a trust-destroying event that can scale to thousands of users before anyone notices.
The benchmark is brutal: under 1%, with the best agents reportedly hitting ~0.01%. You measure it with automated evals (more on those shortly), human spot-checks, and increasingly with LLM-as-judge scoring across 100% of traffic rather than a 2–8% survey sample.
Cost per resolution is the metric that funds you
This is the number that wins budget meetings. It tells you exactly what each resolved task costs to run — and whether that number is trending the right way as your volume grows.
It's only meaningful if you're actually tracking tokens. An agent that loops, over-retrieves, or calls the most expensive model for trivial questions can quietly send cost per resolution climbing while everything else on the dashboard looks fine. The win isn't a one-time figure — it's watching this number fall as you tighten retrieval, right-size the model, and cut wasted steps. That's where operational discipline meets the P&L, and it's exactly the kind of math we walk through in our deeper guide to measuring AI agent ROI.
Want analytics without wiring up a stack?
Pickaxe tracks usage, activity, and conversations for every agent you build — no instrumentation required.
The four layers of an agent analytics stack
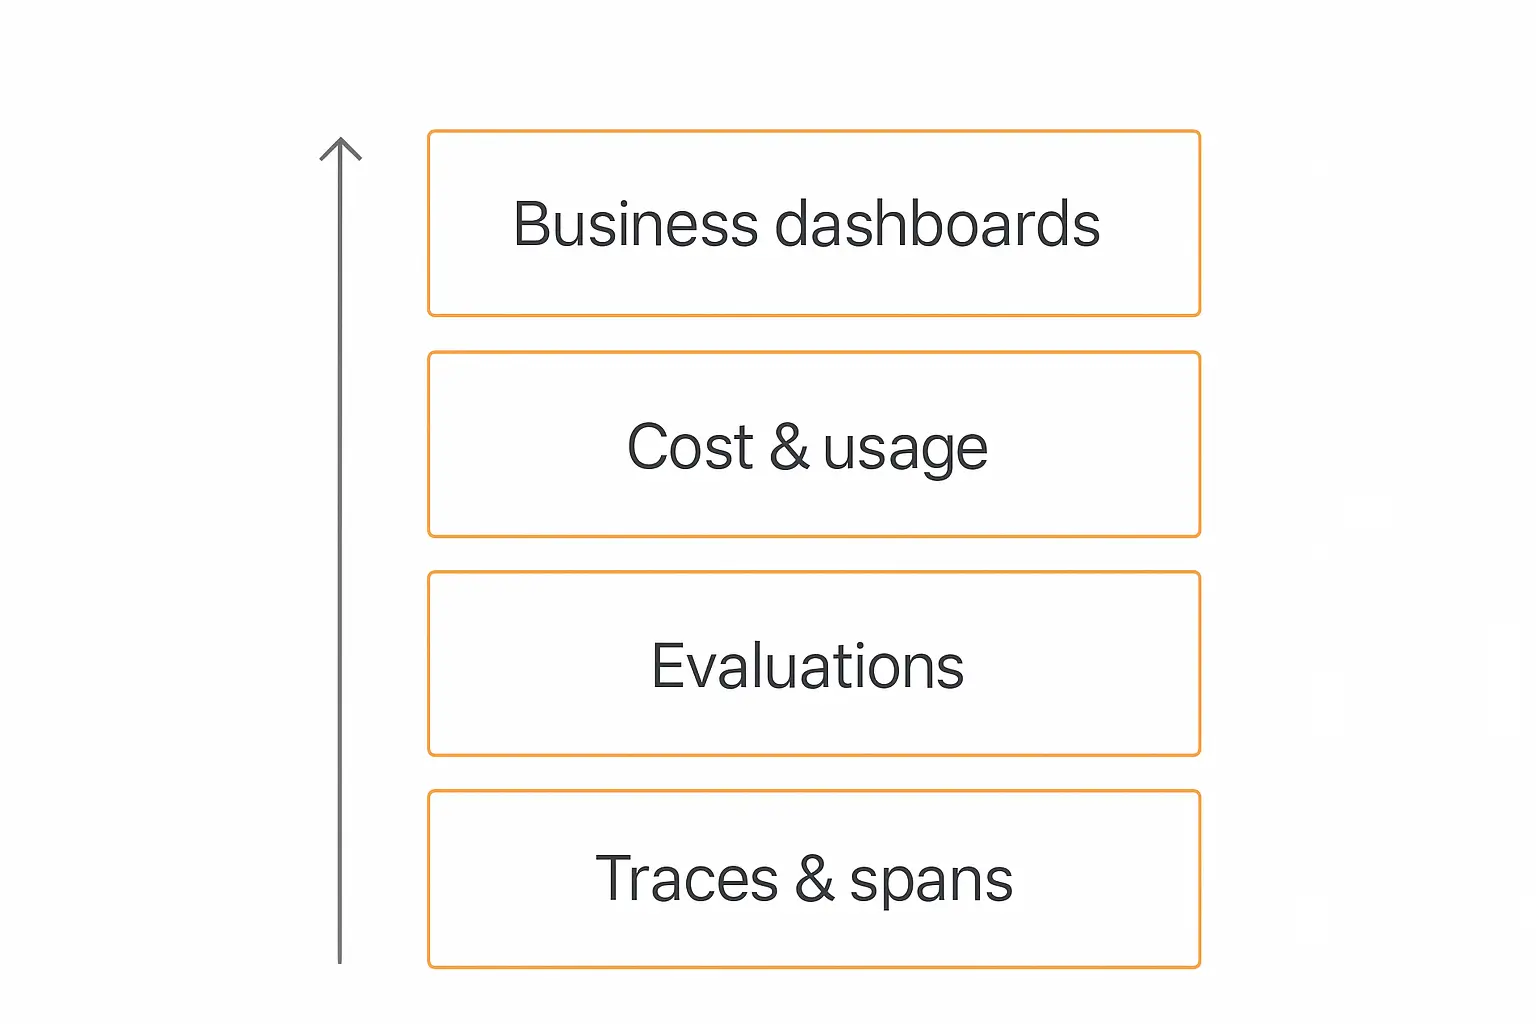
It helps to picture agent analytics as a stack. Each layer feeds the one above it. Skip a layer and the layers above it are built on sand.
From the ground up:
- Traces & spans (the raw record). Every model call, tool invocation, retrieval, and decision, captured as a structured, replayable trace. This is the foundation. If you can't see what the agent did step by step, nothing above this layer is trustworthy.
- Evaluations (the quality judgment). Automated scoring of those traces — faithfulness, relevance, accuracy, safety, tone. Evals turn a pile of logs into a quality signal you can chart over time.
- Cost & usage (the economics). Token consumption, model breakdown, and dollar cost, attributed down to the individual agent, workflow, or conversation. This is where you catch the runaway loop before the invoice does.
- Business dashboards (the so-what). Resolution rate, ROI, CSAT, containment — the rolled-up numbers a stakeholder actually reads. This layer is only as honest as the three beneath it.
The reason the order matters: a beautiful business dashboard sitting on top of zero trace data is just a guess with good typography. Build bottom-up.
Frameworks worth stealing
You don't have to invent your scorecard from scratch. Several organizations published agent measurement frameworks in 2026, and they rhyme with each other in useful ways.
Google Cloud's three-pillar model splits measurement into reliability (does it work consistently?), adoption (are people actually using it?), and business value (is it moving a real number?). The genius here is treating adoption as a first-class metric — a technically perfect agent nobody uses is still a failed project.
Workday's framework sorts KPIs into task-specific accuracy, operational efficiency, user experience, and strategic alignment. It maps almost one-to-one onto the four tiers in the table above.
NiCE's six-layer KPI framework goes deeper, adding risk/governance and agent-experience layers — useful if you're in a regulated industry where "did it leak data or breach policy?" is as important as "did it resolve the ticket?"
The takeaway across all of them: measure reliability, adoption, and value as separate tracks. A single blended score hides exactly the trade-offs you most need to see.
Your scorecard changes with the job
One mistake I want to flag before the tooling: there is no universal agent scorecard. A customer-support agent, a lead-qualification agent, and an internal research agent fail in completely different ways, so they need different front-page metrics.
Here's how I'd weight the scorecard by agent type:
| Agent type | Headline metric | Watch closely | Easy to ignore (don't) |
|---|---|---|---|
| Customer support | Resolution rate | Reopen rate, CSAT delta | Hallucination rate |
| Lead qualification | Qualified-lead accuracy | False-positive rate, cost per lead | Escalation timing |
| Internal ops / automation | Task accuracy | Tool-call success, cost per task | Silent failures |
| Research / analysis | Faithfulness (cited sources) | Hallucination rate, latency | Coverage gaps |
| Multi-agent system | End-to-end success | Per-agent attribution, handoff errors | Loop / runaway cost |
The lead-qualification row is the one people underweight. An agent that marks bad leads as "qualified" looks productive on a volume chart while quietly poisoning your sales pipeline — the false-positive rate is the metric that actually protects revenue there.
Multi-agent setups deserve their own caution. Once you have agents calling agents, a single rolled-up success number hides which agent in the chain is failing. You need per-agent attribution, or you'll spend days debugging the wrong node. If you're heading in that direction, our explainer on how multi-agent systems work covers the coordination patterns that make this tractable.
The observability tools you'll actually wire up
Now the practical part. If you're building agents in code, you'll reach for an observability platform to capture traces and run evals. The landscape consolidated a lot in 2026 — here's how the main players actually differ.
| Tool | Best for | Notable detail |
|---|---|---|
| Langfuse | Self-hosted / open-source teams | Genuinely free, no per-seat pricing; acquired by ClickHouse in Jan 2026 |
| LangSmith | LangChain / LangGraph stacks | Deepest framework integration; near-zero measured overhead |
| Arize Phoenix | ML-grade eval rigor | Ships with 50+ research-backed metrics (faithfulness, toxicity, hallucination) |
| AgentOps | Multi-agent debugging | Session replay + hierarchical multi-agent tracking |
| Datadog LLM Observability | Enterprises already on Datadog | Folds agent traces into existing infra monitoring |
| Helicone | Simplest possible install | Drop-in proxy; one line to start logging |
A few honest notes from comparing them. Observability isn't free — independent benchmarks clocked LangSmith at virtually no measurable overhead, while AgentOps and Langfuse added roughly 12% and 15% respectively. That's a reasonable trade for the visibility, but it's not zero, so measure it in your own environment.
If you want a fuller breakdown of the live landscape, AIMultiple's roundup of agentic monitoring tools and Splunk's writeup on agent monitoring are both worth a read.
And the honest caveat: every one of these assumes you're comfortable instrumenting code. If you're building no-code agents for clients, you want the analytics baked into the platform instead — which is the path I'll come back to at the end.
How to instrument an agent, step by step
Here's the workflow I'd follow to go from "blind agent" to "fully observable agent." It's the same shape whether you're in code or on a platform.
- Capture traces first. Before you measure anything, make sure every run produces a complete trace — inputs, each model call, each tool call, the final output. You can't improve what you can't replay.
- Instrument cost at the same time. Log tokens and model per step. Cost attribution is painful to backfill, so wire it up from day one. The key question you're enabling: which agent, workflow, or conversation is driving spend?
- Define your scorecard. Pick 2–3 metrics per tier from the table above. Don't track everything — track the handful that map to why this agent exists.
- Add evals on the quality metrics. Set up automated scoring (LLM-as-judge or rule-based) for hallucination, accuracy, and tone so quality is measured continuously, not just when someone complains.
- Build the rollup. Aggregate into a dashboard a non-engineer can read. Resolution rate and cost per resolution belong on the front page.
- Set alerts on the dangerous ones. Cost spikes, hallucination-rate jumps, and tool-failure surges should page you. A single misconfigured agent scaling an error across thousands of conversations is the failure mode you're guarding against.
One thing analytics consistently surfaces that nothing else does: memory and context problems. When an agent's cost mysteriously climbs or its answers drift, the trace usually points at context bloat — too much stuffed into the window. If that's your pattern, our breakdown of how AI agent memory works explains how to fix it at the root.
What a single trace actually tells you
It's worth getting concrete about why traces sit at the bottom of the stack. Let me walk through a real-shaped example — the kind of thing you'd see drilling into one expensive conversation.
Say your cost dashboard flags a support conversation that burned 18,000 tokens and still escalated to a human. On the surface that's just a bad outcome. The trace tells you the story:
- Step 1 — user asks about a refund. Agent calls the knowledge-base retrieval tool. Returns nothing relevant.
- Step 2 — agent retries the same retrieval with a slightly reworded query. Still nothing.
- Step 3 — agent retries a third time, then a fourth, each time pulling more context into the window. Token count balloons.
- Step 4 — agent gives up and escalates.
Without the trace, you have a vague "expensive escalation." With it, you have a diagnosis: the refund policy isn't in the knowledge base, and the agent has no retry ceiling. Two specific, fixable problems. Add the missing doc, cap retries at two, and that 18,000-token failure becomes a 1,200-token resolution.
This is the entire argument for instrumenting traces before anything else. Aggregate metrics tell you that something is wrong. Only the trace tells you what — and "what" is the only thing you can actually fix.
Turning analytics into a better agent
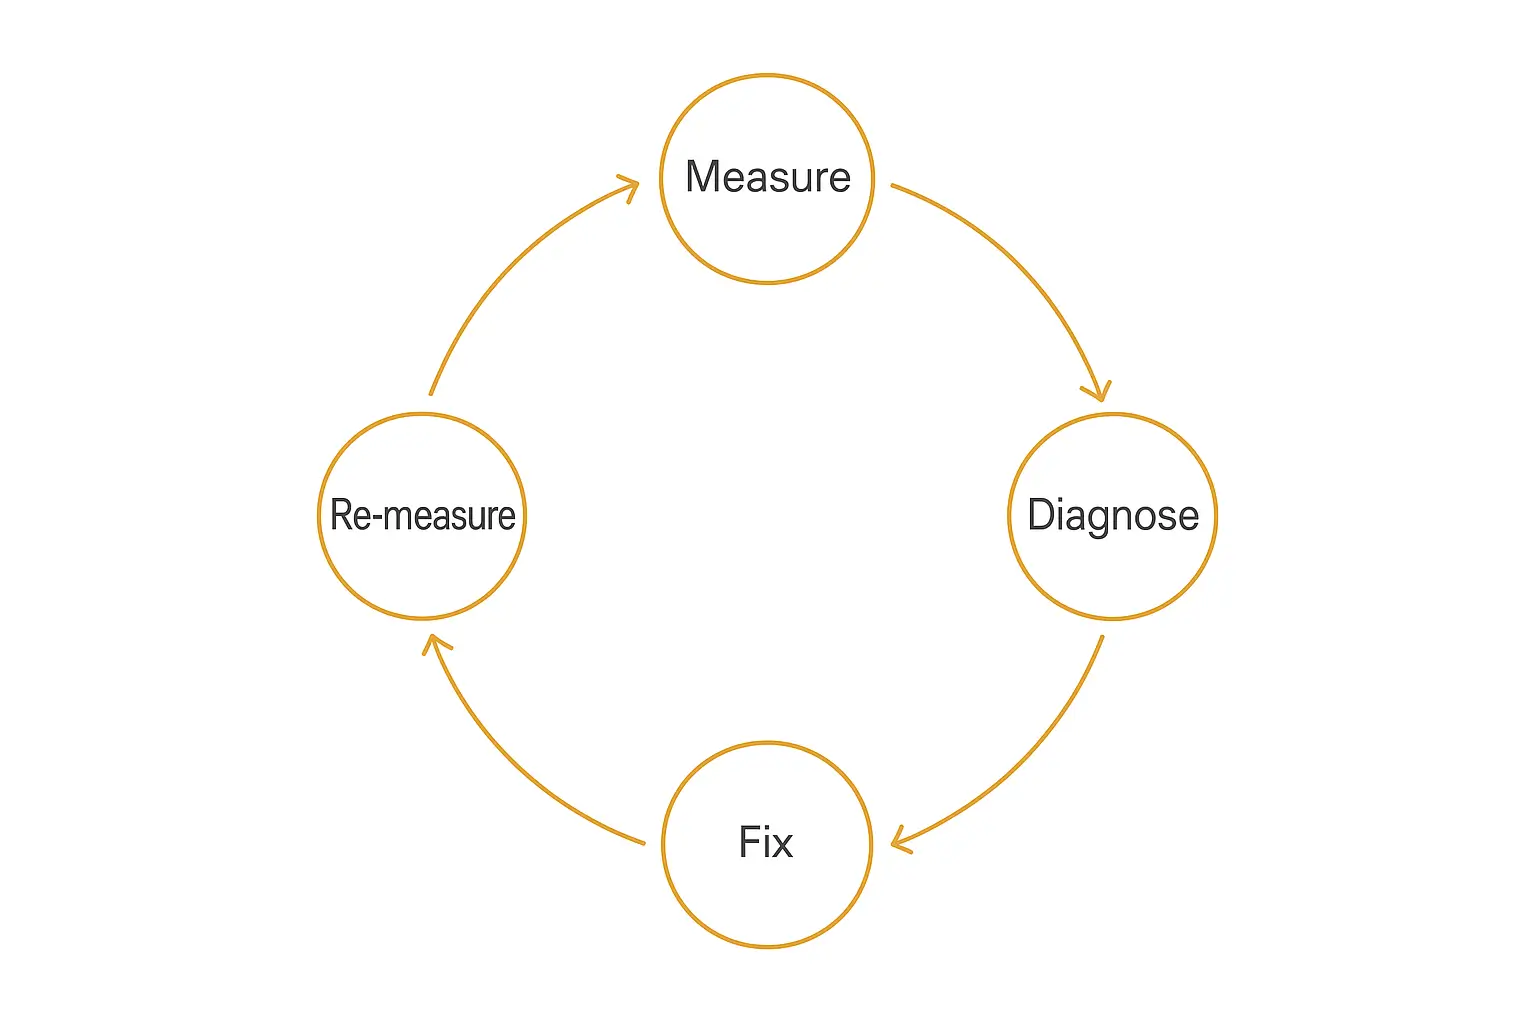
Collecting metrics is the easy half. The point of AI agent analytics is the loop it powers: measure, diagnose, fix, re-measure. An agent that runs this loop gets better every month. One that just accumulates dashboards gets older.
Here's the loop in practice:
- Measure. Your scorecard flags a weak number — say, resolution rate stuck at 20%.
- Diagnose. You drill into the traces behind the failures. This is where trace data earns its keep: you find the agent was missing a knowledge source it kept getting asked about, or fumbling a specific tool call.
- Fix. You make the targeted change — add the missing docs, rewrite the tool trigger, tighten the prompt.
- Re-measure. You watch the same metric on the same cohort to confirm the fix actually moved it.
This isn't theoretical. One case study making the rounds described an agent that climbed from a 20% to a 60% containment rate after focused changes driven entirely by what the measurement data revealed. Same model. Triple the value. The only thing that changed was that someone looked at the traces and acted on them.
That diagnostic step is also where analytics overlaps with testing. The best teams don't wait for production to surface problems — they catch them in a structured test pass first. If you haven't built that habit, our guide to testing and debugging your AI agent before deploying pairs naturally with everything here.
Build, deploy, and measure in one place
Spin up a client-ready agent, watch its activity, and iterate — without stitching together five tools.
Common analytics mistakes I keep seeing
A few traps that catch even experienced teams:
Tracking activity instead of outcomes. Conversations handled, messages sent, tokens used — these feel like analytics but they're just activity. If a number can go up while your customers get angrier, it's not an outcome metric.
Optimizing one metric into the ground. Push resolution rate too hard and the agent starts bluffing answers to avoid escalating — your hallucination rate quietly spikes. Always watch metrics in tension with each other.
Sampling quality instead of measuring it. CSAT surveys capture 2–8% of conversations, and the people who respond aren't a random sample. Automated evals across 100% of traffic give you maybe 5x the coverage and far less bias.
Ignoring adoption. Per Google Cloud's framework, a flawless agent nobody uses is a failed project. Track whether usage is actually growing.
Backfilling cost data. If you don't capture tokens and model per step from the start, you'll never cleanly attribute spend later. Instrument economics on day one.
The no-code shortcut: analytics that ship with the agent
Everything above assumes you're assembling an observability stack in code. That's the right call if you're an engineering team running custom agents. It's the wrong call if you're a consultant or creator who just wants to ship an agent to a client and see how it's doing.
This is where Pickaxe fits the way I use it. Because Pickaxe handles the whole stack — build, deploy, and monetize in one place — the analytics come along for free. Every agent you publish tracks usage and activity out of the box, and you can see the conversations flowing through it without standing up Langfuse, wiring traces, or writing a single line of logging code.
That matters more than it sounds. The reason most no-code agents fly blind isn't that the builder doesn't care about metrics — it's that bolting observability onto a tool you didn't build is genuinely hard. When usage tracking and activity monitoring are native to the platform, the measure-diagnose-fix loop is just... there.
You still bring the discipline — picking the right scorecard, acting on what the data says. But you skip the part where you spend two weeks instrumenting before you can measure anything. For agencies running agents across a dozen clients, that's the difference between analytics being a project and analytics being a habit. It's the same philosophy behind the rest of the modern agent tech stack: own less plumbing, ship more value.
Frequently asked questions
What is the difference between AI agent analytics and observability?
Observability is the foundation layer — the raw traces, spans, and logs of what the agent did. Analytics is the broader practice that sits on top: scoring quality, attributing cost, and rolling everything into business metrics like resolution rate and ROI. Observability tells you what happened; analytics tells you whether it was good and what to do about it.
What is the single most important AI agent metric?
If forced to pick one, resolution rate — the share of requests fully handled end-to-end without a human. But every serious 2026 framework agrees no single metric is enough; you need a balanced scorecard across outcome, quality, cost, and business impact, because optimizing one in isolation silently damages the others.
How do I track AI agent costs?
Log token usage and the model used at every step of every run, then attribute that cost down to the individual agent, workflow, or conversation. The hard part is attribution — knowing which agent or interaction drove a spike — so instrument it from day one rather than trying to backfill. Cost per resolution is the headline number to watch, and the goal is to keep it trending down as you optimize.
What's a good hallucination rate for an AI agent?
Below 1% is the working benchmark, with the best-instrumented agents reportedly reaching around 0.01%. Measure it with automated evals across as much of your traffic as possible, not just occasional human spot-checks.
Do I need a dedicated observability tool?
If you're building custom agents in code, yes — something like Langfuse, LangSmith, or Arize Phoenix. If you're building no-code agents on a platform that already tracks usage and activity, the analytics are built in and a separate tool is usually overkill.
The bottom line
The 40% of agent projects Gartner expects to die mostly won't die from bad models. They'll die because nobody could prove they were working.
AI agent analytics is how you stay in the other 60%. Capture the traces, score the quality, track the cost, and roll it up into a scorecard that tells the truth — then actually run the measure-diagnose-fix loop until the numbers move. That's the whole game. An agent you can measure is an agent you can defend, fund, and improve.
If you'd rather not spend your first two weeks building dashboards, that's the case for letting the platform handle it. Build your first agent on Pickaxe and you'll have usage and activity tracking from the moment it goes live — so you can spend your time improving the agent instead of instrumenting it.