

LLM observability becomes useful when a client says an AI agent did something wrong and you need to explain exactly where it happened. A transcript shows the conversation, but it may not show the failed lookup, repeated model call, or tool response that caused the problem.
I looked through the documentation and current pricing for six platforms that help investigate those failures. My recommendation is to choose around the evidence your team needs during an incident, then compare what it takes to collect, retain, and act on that evidence.
This is a documentation-based comparison, checked on September 15, 2026, rather than a production benchmark. The pilot workloads and incident examples below are illustrative, and the recommendations are judgments about fit.
LLM observability tools: the short list
For a small technical team starting from scratch, I would put Langfuse and Phoenix on the first shortlist. LangSmith deserves an early look for LangGraph teams, Braintrust for a strong production-to-evaluation workflow, Opik for integrated tracing and testing, and Datadog for teams already investigating infrastructure there.
| Tool | Where I would start | Published entry point | Question to validate |
|---|---|---|---|
| Langfuse | General application tracing and prompt iteration | Free Hobby; Core $29/month | How many billable units does one complete job produce? |
| LangSmith | LangGraph and LangChain debugging | Free Developer; Plus $39/seat/month plus usage | Which traces need longer retention? |
| Arize Phoenix | Local or self-hosted investigation | Free self-hosting under ELv2 | Who owns operations and access controls? |
| Braintrust | Turning production failures into evaluated changes | Starter $0 platform fee; Pro $249/month plus usage | What will data processing and scoring consume? |
| Opik | Tracing, assertions, and experiments together | Free cloud; Pro Cloud $19/month | Does the intended SDK cover the full workflow? |
| Datadog Agent Observability | Investigating AI inside an existing operations stack | Free tier; Pro from $160/month, annual pricing | Can an agent trace connect to the failing service? |
These prices are starting points with different allowances and billing units. The linked pricing pages in each section are the source for plan details; a trace, span, observation, and gigabyte are not interchangeable units.
Pickaxe serves a different part of the stack: building and distributing agents through branded portals. Before adding a tracing platform to a no-code project, establish which runtime events your builder actually exposes and which custom services your team controls.
What LLM observability should reveal
A trace connects operations belonging to a request, while a span records one operation inside that trace. OpenTelemetry's trace documentation explains the parent-child relationships that let you follow work across services.
For an agent, useful operations might include reading a request, retrieving documents, calling a model, invoking a tool, and preparing the reply. Recording only model calls can leave the actual failure outside the picture.
Consider a fictional appointment agent that says it booked a meeting. The calendar request timed out, the agent retried, and the calendar now contains two events.
The investigation needs the original request, both attempts, the calendar responses, and the final message tied together. A graph showing average token cost will not settle whether one customer received two invitations.
- Monitoring tells you that a rate, cost, or latency changed.
- Tracing helps reconstruct what happened during a particular job.
- Evaluation judges whether the behavior met an expectation.
- Product analytics describes usage and business outcomes across users.
Our AI agent analytics guide covers the business measurement side. This comparison focuses on the investigation underneath those metrics, including the data you need to reproduce a failure.
Do not treat a visible trace as access to a model's complete internal reasoning. It records the events and outputs your application and integrations expose, which can still be enough to locate a broken action or unsupported claim.
1. Langfuse: a practical starting point for application tracing
I would shortlist Langfuse when a team wants tracing, prompt management, and evaluation in a framework-flexible workflow. Its observability documentation describes recording nested operations and inspecting application behavior, latency, and costs.
The attraction for a consultant is having one place to ask what changed between two runs. I would begin with a client-scoped project and consistent metadata for environment, release, and workflow before adding elaborate dashboards.
Pricing: The current pricing page lists Hobby with 50,000 units per month, two users, and 30 days of data access. Core is $29 per month with 100,000 included units, unlimited users, and 90 days of access; its listed initial overage rate is $8 per 100,000 units, with volume reductions.
That is an approachable entry point, but I would measure a representative job before forecasting the bill. A multi-step agent can generate a different amount of telemetry from a single-turn chatbot, even when both serve the same number of users.
My pilot: Create a successful lookup, an empty retrieval, and a tool timeout. Ask a teammate who did not build the agent to locate the decisive evidence in each trace and explain which component they would change.
The tradeoff I would watch is operational ownership. If your reason for choosing a platform is self-hosting, budget time for upgrades, backups, storage growth, and restoring a broken deployment.
A second concern is metadata discipline. If one developer calls a customer identifier client_id and another records it only inside a prompt, cross-client investigation becomes unnecessarily fragile.
Choose it when your team wants a broadly useful tracing workspace and will invest in instrumentation. Validate the deployment and permission features you need before treating the least expensive plan as the complete agency setup.
2. LangSmith: an early shortlist for LangGraph teams
LangSmith is a natural candidate when the application already uses LangChain or LangGraph. Its observability guide also supports tracing other frameworks, so using it does not require rewriting an existing application into LangChain.
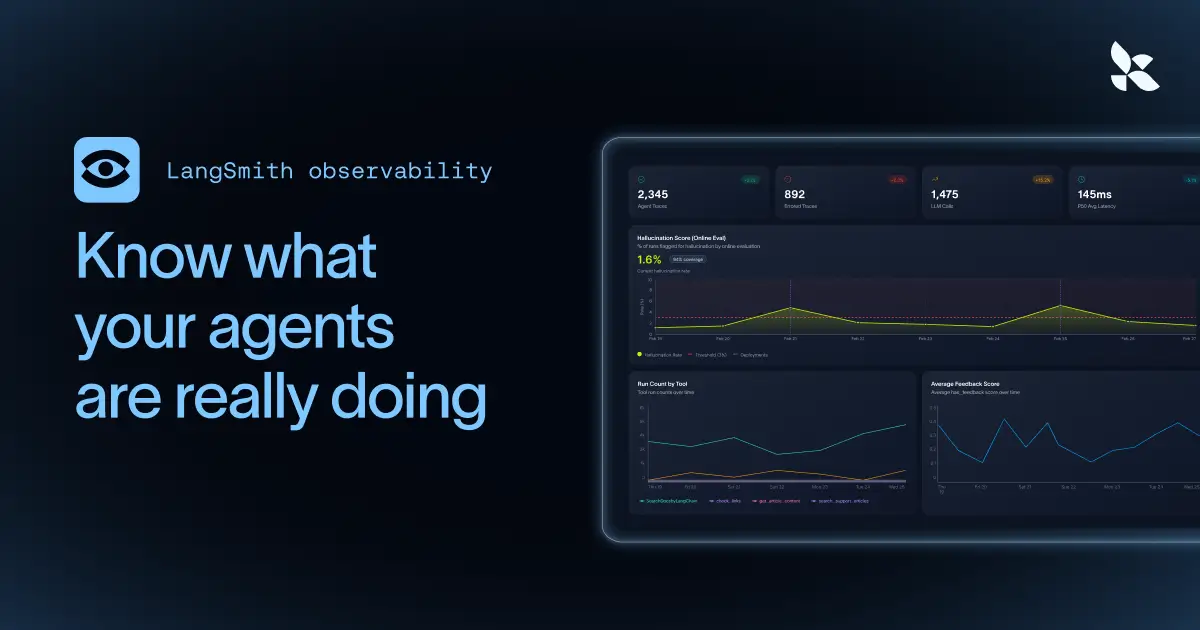
I would evaluate it on how clearly a trace reflects the application's actual structure. A graph-based workflow should make branches, nested tool work, and failed attempts understandable to the person responsible for fixing them.
Pricing: The published plans include a free Developer tier with one seat and 5,000 base traces per month. Plus is $39 per seat per month with 10,000 base traces included, followed by usage billing; the page separately describes storage and compute metering.
For an agency, the seat dimension deserves attention before inviting every client stakeholder. Decide who actually needs the trace interface, who needs a sanitized incident report, and how retained traces contribute to the total.
My pilot: Take one graph workflow with a retry branch and a human handoff. Check whether a reviewer can distinguish the initial failure, recovery attempt, and final state without consulting three disconnected logs.
The tradeoff is buying more platform than the project needs. If the sole requirement is finding a slow provider request, a broader deployment and evaluation ecosystem may add decisions before it removes them.
I would also test an integration that is outside the team's preferred framework. The happy path through a native integration is useful, but a client project often includes a custom webhook or older service that needs manual instrumentation.
Choose it when workflow debugging and the surrounding LangChain development process fit together for your team. Judge that fit using your own trace, and keep a written list of events the automatic integration did not capture.
3. Arize Phoenix: local investigation with deployment control
Phoenix belongs on the shortlist when you want to inspect traces locally or operate the backend yourself. Its documentation covers tracing, evaluations, prompt iteration, and experiments, with Python and TypeScript entry points.
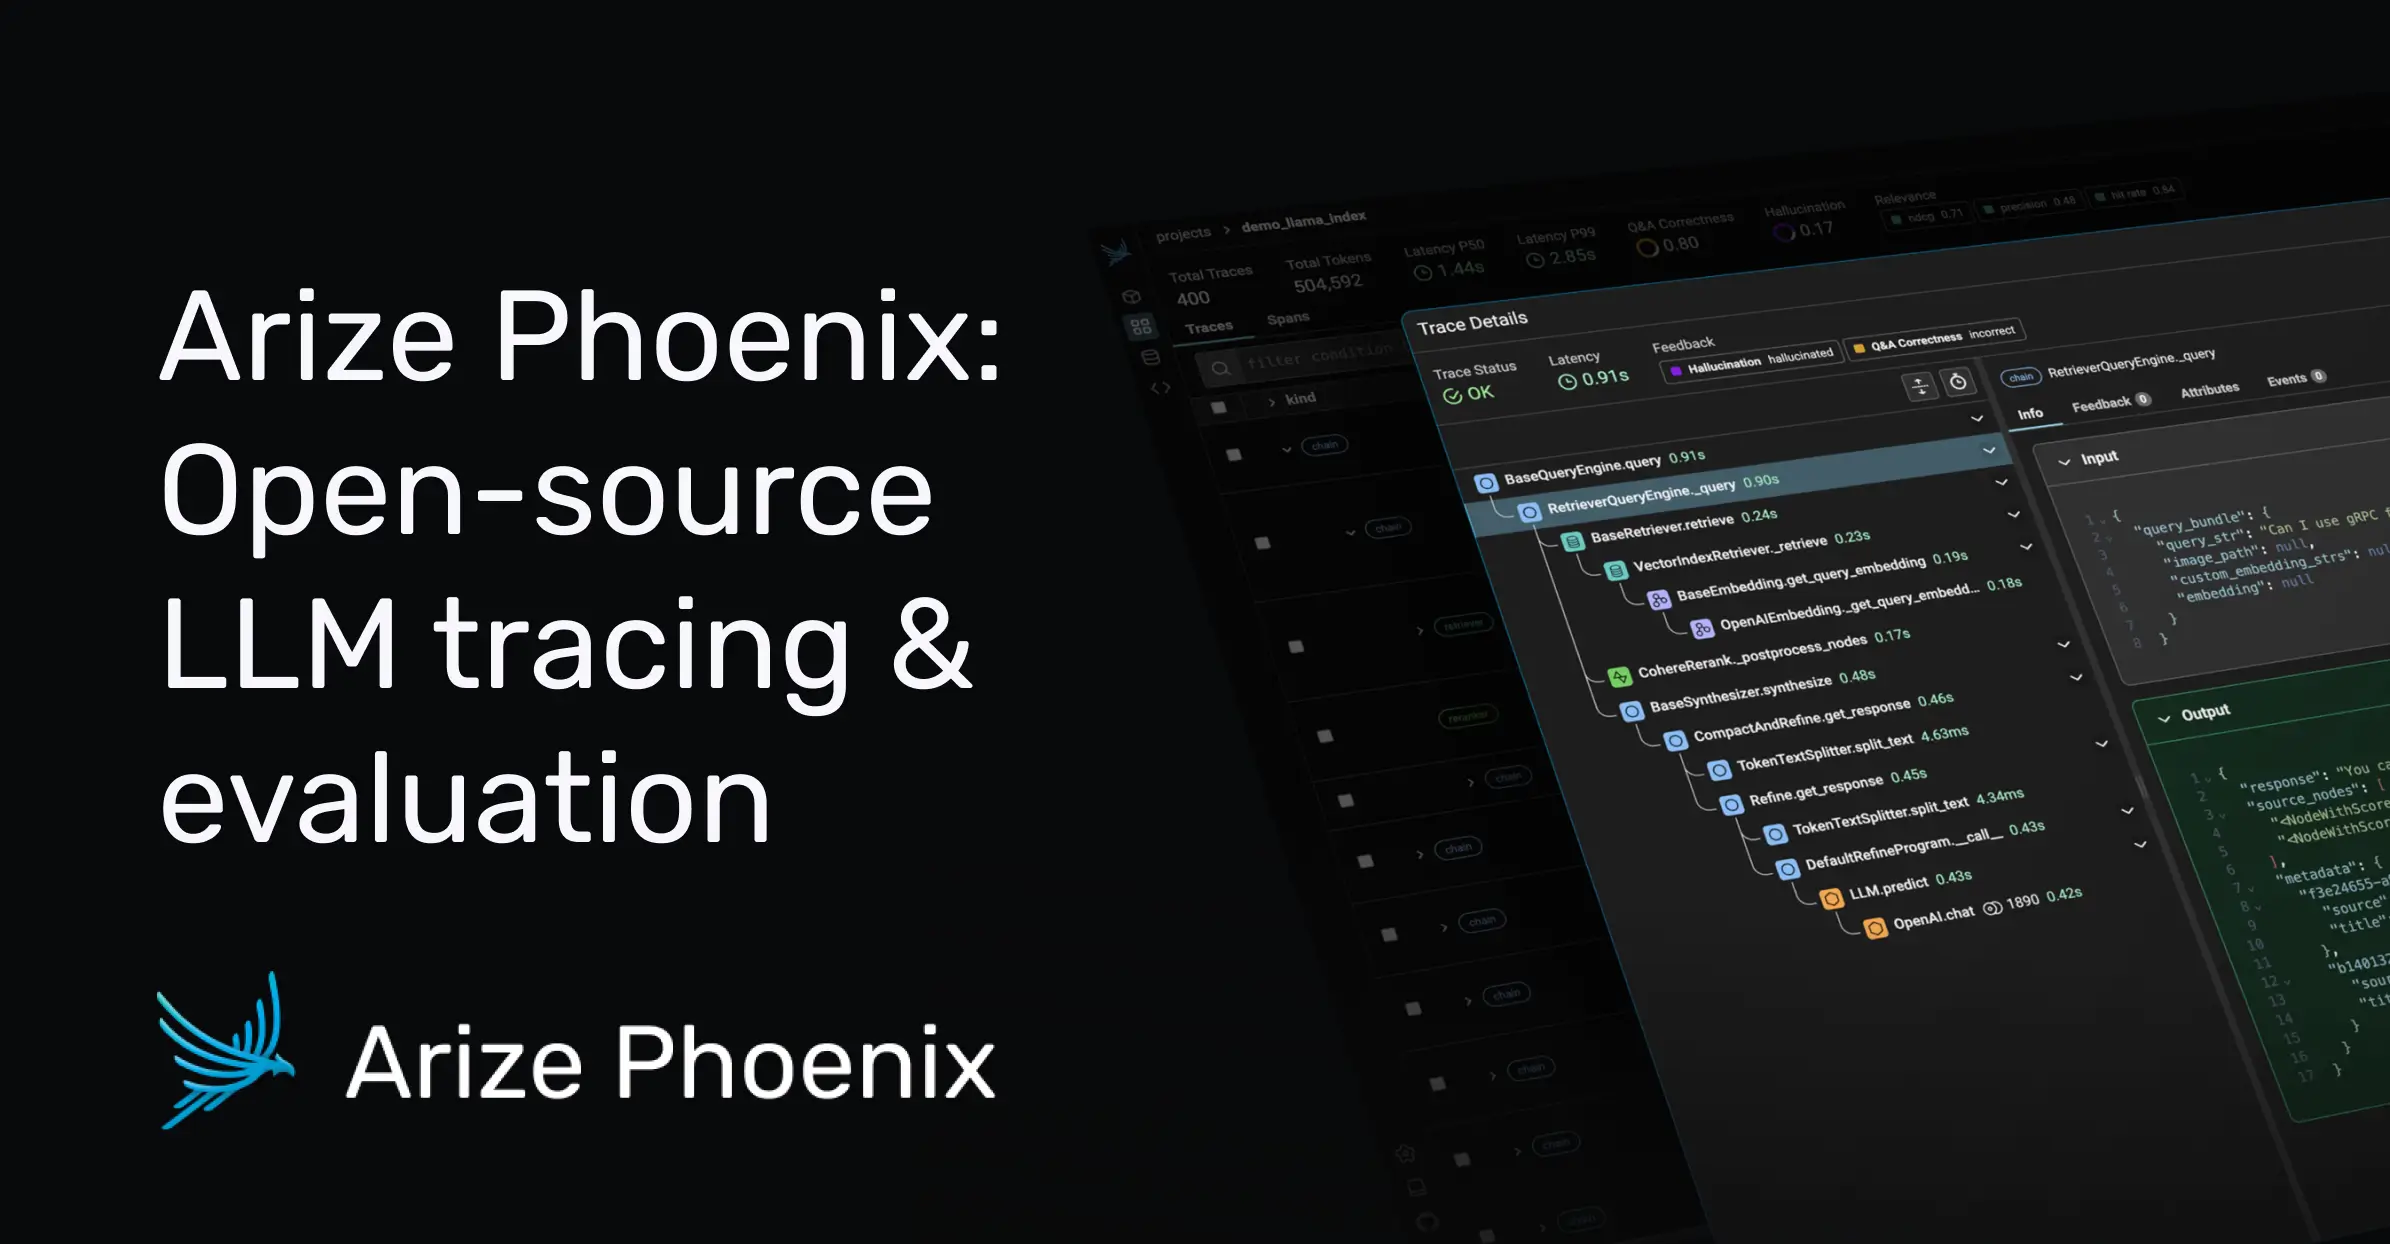
I like the local investigation angle for a narrowly scoped pilot. A builder can start by making one failing workflow legible, then decide what production hosting and access management need to look like.
License and pricing: Phoenix is free to self-host under Elastic License 2.0. That is a source-available license with conditions, so do not describe it to a client as an unrestricted MIT or Apache-licensed component.
Arize AX is a separate commercial offering. The AX pricing page lists a free plan and a $50 monthly Pro plan; those are not fees for running your own Phoenix instance.
My pilot: Capture a retrieval failure where the model receives irrelevant context. Verify that the trace contains enough document identifiers, relevant excerpts, and request structure to explain why retrieval went wrong.
Then export the evidence and hand it to another builder. If the explanation depends on your laptop remaining open, the project still needs a shared operating process.
The tradeoff is that local control does not remove maintenance work. Someone must decide who can access the service, how long data stays, what happens when storage fills, and how the instance is restored.
If your business plans to sell a hosted observability service, examine the license terms against that business model before building around it. Self-hosting for your application and offering the underlying software as a managed service are different decisions.
Choose it when local debugging and control over deployment are central requirements. Include a production-readiness review in the proposal if the pilot will become shared infrastructure.
4. Braintrust: connect production evidence to evaluated changes
I would shortlist Braintrust when the difficult part is turning a failure backlog into a reliable improvement process. Its observation workflow connects logs, trace investigation, datasets, and analysis tools such as Patterns, Topics, and Debugger.
The useful question is whether the team can carry one incident all the way through: find the bad run, identify an expectation, make a change, and check similar cases. A clean dashboard is only the first part of that work.
Pricing: Braintrust's pricing page lists Starter with a $0 platform fee and usage allowances. Pro is $249 per month, including 5 GB of processed data and 50,000 scores, with listed overages and separate retention and model-related charges.
I would forecast data volume and evaluation activity separately. Long retrieved documents can expand the stored record, while evaluating every production run introduces another workload that should have its own budget.
My pilot: Start with a fictional answer that cites an outdated policy. Turn that incident into a reusable case, compare the proposed retrieval change, and have a reviewer explain why the new result passes.
Our AI agent evals guide explains how to build the acceptance criteria behind that exercise. The tracing platform preserves evidence, but the team still needs to define what an acceptable outcome means.
The tradeoff I would watch is overautomating the diagnosis. A system-generated issue category or suggested fix should point to inspectable evidence, especially when the proposed change could affect several clients.
I would also check whether a useful trace can be exported with the fields needed for an external incident record. Evidence should remain understandable when someone reads the client report a month later.
Choose it when you want investigation and evaluation to become one repeatable routine. Set aside time for maintaining the datasets and reviewing automated judgments, not just collecting more logs.
5. Opik: tracing and testing in one workspace
Opik is worth comparing when you want tracing alongside assertions, evaluation, and prompt experiments. Comet's documentation describes recording model calls, tools, and agent steps, then using that evidence to score and improve application behavior.
For a small agency, the appeal is reducing the number of handoffs between finding a bad run and testing a proposed correction. I would still insist on a named person owning the acceptance rules for each client.
Pricing: The plan cards list Free Cloud with 25,000 spans per month and up to ten team members. Pro Cloud is $19 per month with 100,000 spans and up to fifty members; both cards list 60-day retention.
The same page includes older FAQ wording about unlimited members, so confirm the active plan limits during purchase. I used the explicit plan cards above rather than blending conflicting statements into a more generous allowance.
My pilot: Connect a workflow that looks up a customer record and produces structured output. Check that an incorrect field can be traced to its source, then create an assertion that catches the same mistake on another input.
Test the implementation language you will actually ship. A Python demonstration does not prove that every desired operation is available through the TypeScript SDK or an HTTP integration.
The cost display also deserves a reality check. Opik documents estimated costs and cases where unsupported models can return no estimate, which is a reason to reconcile telemetry with provider billing.
Choose it when the integrated testing workflow matches the way your team works. A low entry price is useful, but successful instrumentation and a clear review process decide whether the tool earns its place.
6. Datadog Agent Observability: connect AI failures to operations
Datadog is particularly worth considering when the client already uses it to investigate services and infrastructure. The current product is called Agent Observability, although many documentation paths and older comparisons still use LLM Observability.
I would focus the pilot on a failure that crosses the model boundary. For example, an agent's slow answer could begin with a database query, a tool service, or an overloaded dependency rather than model generation.
Pricing: The current pricing page shows a free tier with 40,000 LLM spans per month. Pro starts at $160 per month on annual pricing with 100,000 LLM spans included and $3.50 per additional 10,000; the page specifies billing for model-call spans rather than every tool or retrieval span.
That distinction makes a flat comparison against another vendor's total span count misleading. Forecast the actual model calls, then include any additional Datadog products and retention options needed for the proposed setup.
My pilot: Trigger a controlled timeout in a test tool service. Ask the operations owner to move from the agent's failed run to the underlying service evidence and back to the affected workflow.
The tradeoff is scope and ownership. Bringing in a broader operations platform for one small chatbot can create more configuration than the team needs; adding AI visibility to an existing stack may be much more natural.
I would also validate cost completeness before using dashboards for client chargebacks. Datadog's cost documentation distinguishes partial cost from unavailable cost when some calls cannot be priced.
Choose it when the AI workflow sits inside an application the operations team already owns. The strongest reason is a clearer incident investigation across the whole service, not another standalone token chart.
Why Helicone is outside this new-project shortlist
Helicone appears in many older comparisons, so its status needs a clear note. In its March 3, 2026 announcement, the team said it was joining Mintlify and that Helicone would remain live in maintenance mode.
The announcement explicitly includes security updates, new models, and bug and performance fixes. Maintenance mode does not mean the service has stopped working, and an existing customer should assess their own requirements before migrating.
For a new client deployment, I would ask about the support and development path before making it a default dependency. That uncertainty is why I kept the main comparison focused on six other options.
Run a small LLM observability pilot before committing
I would give two shortlisted tools the same fictional workload and ask a builder to investigate it. The goal is to discover which product makes your failures understandable, using a setup you can maintain.
Use a small collection of ordinary requests plus deliberate failures. The following set is an example design, not a claim about a sufficient sample size for every production system.
- Successful lookup: A correct record is retrieved and summarized.
- Missing evidence: Retrieval returns nothing and the agent must acknowledge the gap.
- Tool timeout: A dependency fails and the workflow follows its recovery path.
- Repeated action: A retry must not create duplicate records.
- Wrong context: An irrelevant document enters the prompt.
- Long request: A large input exposes token, latency, and retention behavior.
For each case, record whether the trace is complete, whether the decisive event is easy to locate, and whether another teammate can explain it. Measure investigation time as a pilot observation, without turning a handful of attempts into a universal vendor ranking.
Then disconnect the telemetry destination briefly in a test environment. Confirm the application behaves according to your intended failure policy, and that you can tell which trace data was dropped or delayed.
Finally, try an export and a deletion. The pilot is unfinished if the team can collect data but cannot retrieve the relevant incident record or carry out its retention policy.
Use our agent testing and debugging guide for the broader prelaunch process. The observability pilot should leave you with a demonstrated investigation workflow and a list of known blind spots.
Budget for jobs, retention, and review work
Start with a small traffic model: completed jobs × calls per job × captured events per call. Then map those quantities onto each vendor's own billing definitions instead of calling everything a request.
For illustration, 10,000 monthly jobs with four model calls each produce 40,000 model calls before additional retries. If each job also creates six tool or workflow spans, a backend may receive 100,000 total spans while a model-span-only meter counts a different quantity.
Those counts do not establish the price for every platform. Payload size, evaluation scores, storage duration, seats, and plan-specific allowances may matter independently.
Build three estimates: expected traffic, a busy month, and a retry-heavy incident. The last one matters because the failure you are investigating can also create extra model usage and telemetry.
Keep review time in the budget. If an automated evaluator flags two hundred runs, someone still needs a process for deciding which are real defects and which deserve attention first.
Set retention around the client's investigation window. A trace that expires before the monthly review may be cheap to store and useless when the client finally reports the problem.
Make traces useful for client work
My minimum incident record would include a request identifier, environment, release version, workflow name, timestamps, and the outcome the user expected. Add tool results and source identifiers where they are necessary to explain the behavior.
Keep secrets and unnecessary personal data out of captured payloads. Test redaction using a deliberately fake sensitive value and inspect the stored record, rather than assuming a configuration checkbox proves the whole path is covered.
Separate client access deliberately. A filter on a dashboard is a convenient view, but it is not proof that one client's users cannot access another client's data.
For Pickaxe projects, map visibility before promising a third-party integration. You may be able to instrument a custom Action service you own while having less visibility into the hosted agent runtime; that boundary should appear in the proposal.
The same applies to knowledge-backed answers. If a trace cannot expose the retrieval event, preserve whatever source references and outcome evidence the actual platform makes available, and describe the remaining gap plainly.
Our multi-step AI workflow guide helps identify the boundaries worth investigating. The more systems a workflow crosses, the more valuable a consistent request identifier becomes.
Trace review also needs to lead somewhere. In an April 4, 2026 X post, LangChain cofounder Harrison Chase described Fleet agents learning by updating their context.
I read that as a useful prompt for the operating process: when evidence suggests a context change, save the proposed change, evaluate it, and record what was deployed. The post is vendor commentary, not independent evidence that automatic updates will improve your agent.
Which tool would I choose first?
I would start with the tool that makes one real failure understandable to the next person who has to fix it. Langfuse and Phoenix are good initial candidates for teams comparing general tracing and deployment control; LangSmith fits naturally into a LangGraph evaluation.
Braintrust and Opik deserve attention when investigation needs to feed a disciplined testing routine. Datadog is especially relevant when the client already investigates the surrounding application there.
You do not need six observability products. You need an evidence trail, an owner for reviewing it, and a way to verify that the next change improves the behavior you care about.
If you are still building the client-facing agent, start with a focused Pickaxe agent and one useful workflow. Decide what you must be able to explain after launch, then choose the visibility that supports that promise.