
ImprovementPlatform ·
See API and MCP costs over time
What it does
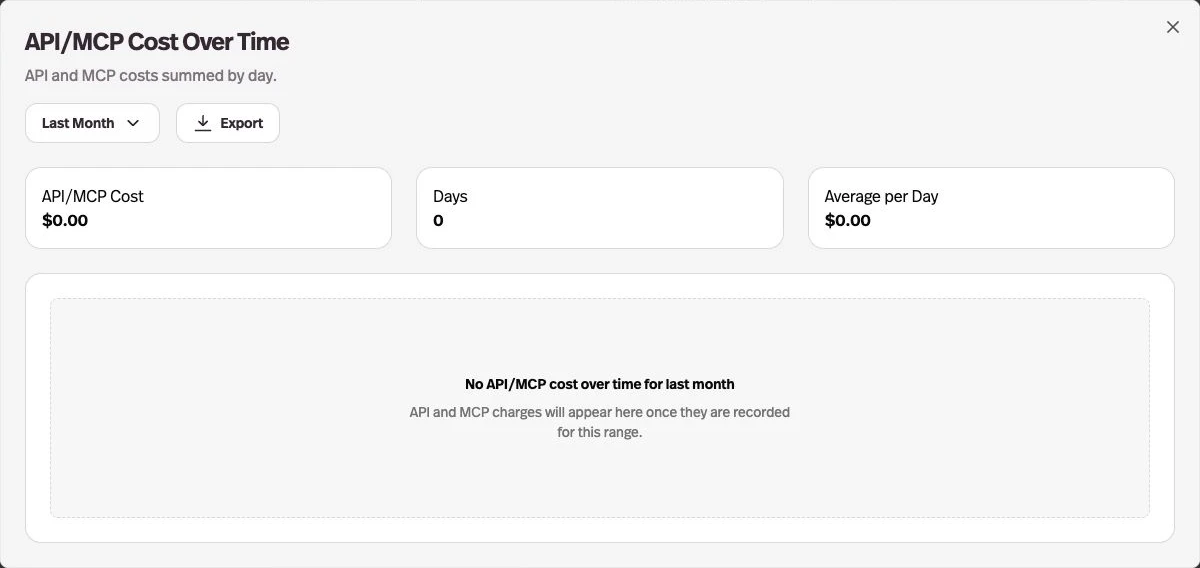
The dashboard adds an API/MCP Cost Over Time chart with daily totals and CSV export.
Before this
An expansion. The dashboard already reported overall costs, without this separate API/MCP view.
Why it matters
Review API-related spending separately from the overall cost chart.
How it works
Open Analytics on the dashboard and find API/MCP Cost Over Time. Choose Last Month or All Time, expand the chart, or export a CSV.
The series combines agent runs recorded with API origin and billed workspace API calls.