
ImprovementBuild ·
Latency, broken into four numbers
Open workspaces
Choose a workspace, then open Activity and select a conversation.
What it does
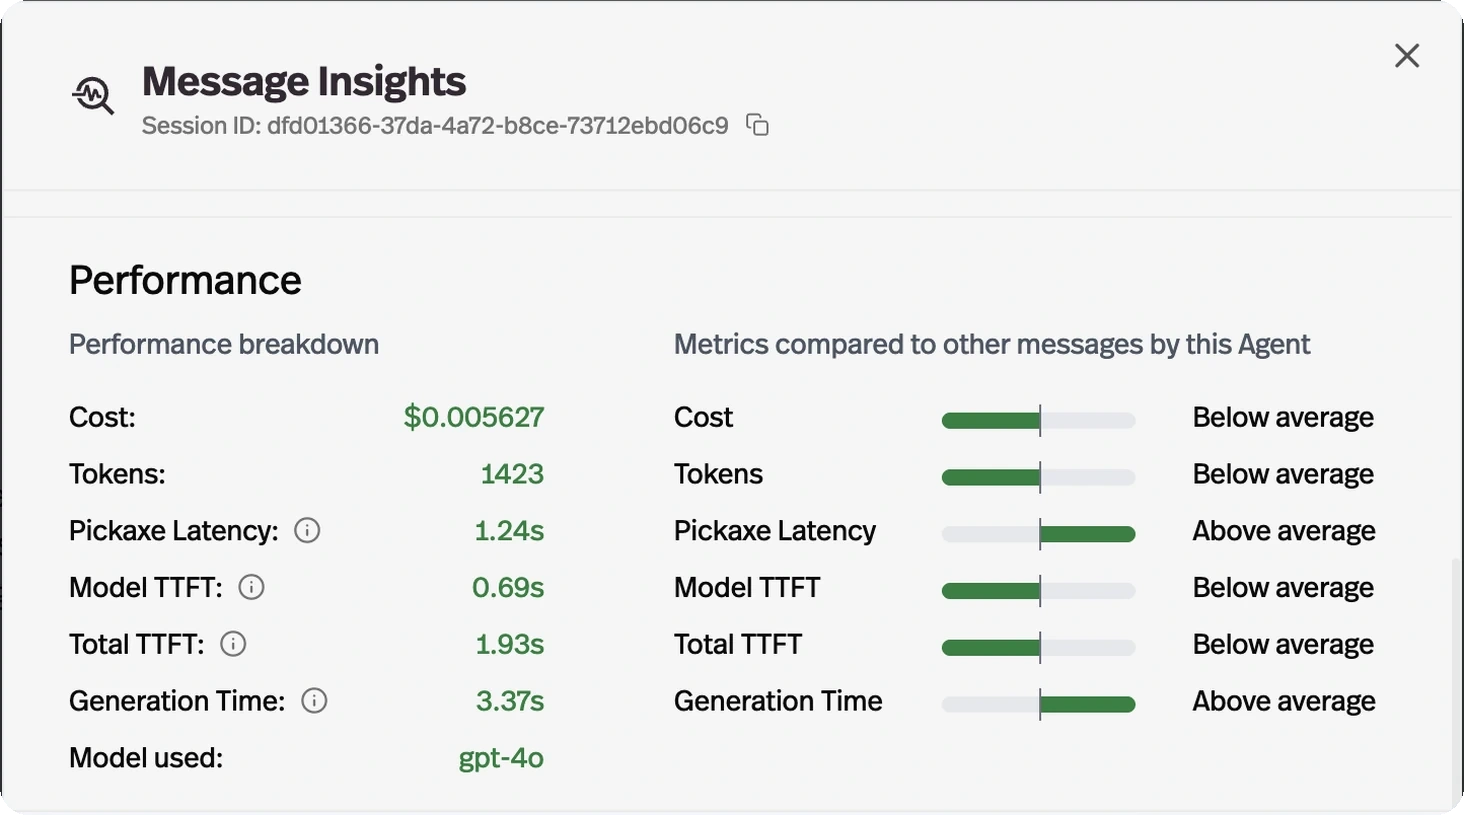
Message Insights splits response time into Pickaxe latency, model time-to-first-token, total time-to-first-token, and generation time.
Before this
An expansion. Response time was already reported, as one number that told you an agent was slow without telling you which part of it was.
Why it matters
One aggregate number tells you an agent is slow. These four tell you whether to trim the knowledge budget, switch models, or shorten the output.
How it works
One number tells you an agent feels slow. These four tell you which part to fix:
- Pickaxe latency
- Our own overhead before the model is called — retrieval, assembly, routing. High here means the knowledge budget or the prompt is doing too much work.
- Model time-to-first-token
- How long the provider took to start answering. High here is a model or provider problem, not yours.
- Total time-to-first-token
- What the user actually waits before words appear — the two above combined.
- Generation time
- How long the answer took to finish once it started. High here means the output is long, and shortening it is the fix.